| Public administration & defence |
10% |
498 |
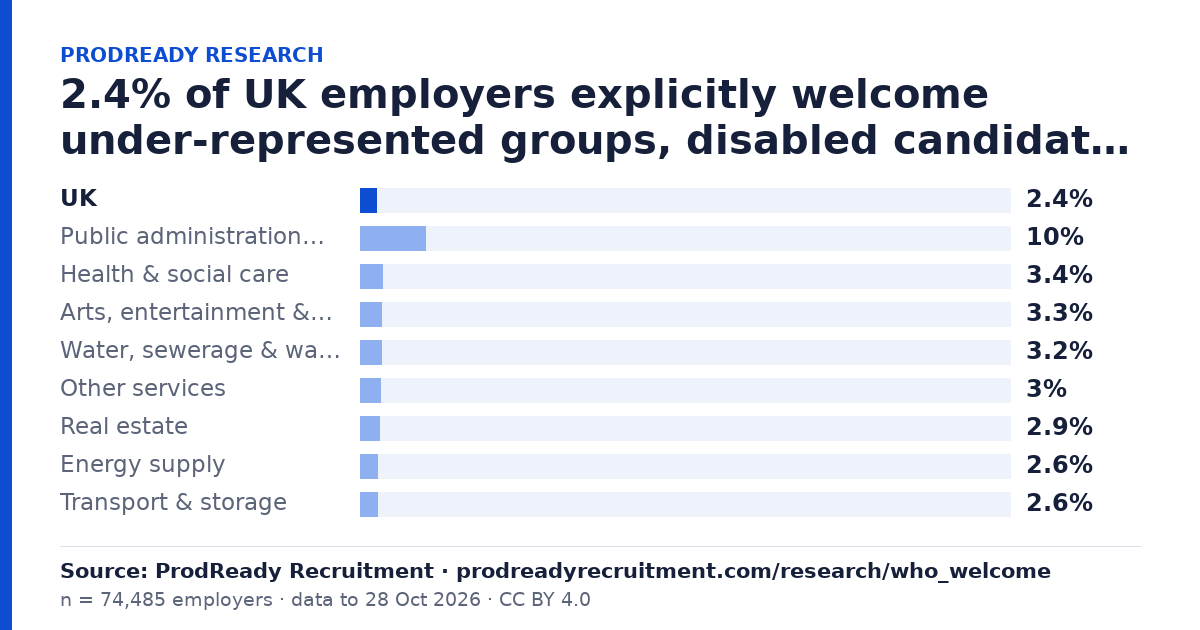
Public administration & defence: 10% of employers explicitly welcome at least one of under-represented groups, disabled candidates or armed forces veterans (n=498 employers). |
| Health & social care |
3.4% |
8,979 |
Health & social care: 3.4% of employers explicitly welcome at least one of under-represented groups, disabled candidates or armed forces veterans (n=8,979 employers). |
| Arts, entertainment & recreation |
3.3% |
4,283 |
Arts, entertainment & recreation: 3.3% of employers explicitly welcome at least one of under-represented groups, disabled candidates or armed forces veterans (n=4,283 employers). |
| Water, sewerage & waste |
3.2% |
444 |
Water, sewerage & waste: 3.2% of employers explicitly welcome at least one of under-represented groups, disabled candidates or armed forces veterans (n=444 employers). |
| Other services |
3% |
6,809 |
Other services: 3% of employers explicitly welcome at least one of under-represented groups, disabled candidates or armed forces veterans (n=6,809 employers). |
| Real estate |
2.9% |
1,764 |
Real estate: 2.9% of employers explicitly welcome at least one of under-represented groups, disabled candidates or armed forces veterans (n=1,764 employers). |
| Energy supply |
2.6% |
388 |
Energy supply: 2.6% of employers explicitly welcome at least one of under-represented groups, disabled candidates or armed forces veterans (n=388 employers). |
| Transport & storage |
2.6% |
1,872 |
Transport & storage: 2.6% of employers explicitly welcome at least one of under-represented groups, disabled candidates or armed forces veterans (n=1,872 employers). |
| Finance & insurance |
2.6% |
2,495 |
Finance & insurance: 2.6% of employers explicitly welcome at least one of under-represented groups, disabled candidates or armed forces veterans (n=2,495 employers). |
| Education |
2.5% |
8,668 |
Education: 2.5% of employers explicitly welcome at least one of under-represented groups, disabled candidates or armed forces veterans (n=8,668 employers). |
| Mining & quarrying |
2.4% |
82 |
Mining & quarrying: 2.4% of employers explicitly welcome at least one of under-represented groups, disabled candidates or armed forces veterans (n=82 employers). |
| Professional, scientific & technical |
2.4% |
7,562 |
Professional, scientific & technical: 2.4% of employers explicitly welcome at least one of under-represented groups, disabled candidates or armed forces veterans (n=7,562 employers). |
| Information & communication |
2.3% |
5,227 |
Information & communication: 2.3% of employers explicitly welcome at least one of under-represented groups, disabled candidates or armed forces veterans (n=5,227 employers). |
| Administrative & support services |
2.2% |
3,970 |
Administrative & support services: 2.2% of employers explicitly welcome at least one of under-represented groups, disabled candidates or armed forces veterans (n=3,970 employers). |
| Agriculture, forestry & fishing |
2.1% |
677 |
Agriculture, forestry & fishing: 2.1% of employers explicitly welcome at least one of under-represented groups, disabled candidates or armed forces veterans (n=677 employers). |
| Construction |
1.7% |
5,482 |
Construction: 1.7% of employers explicitly welcome at least one of under-represented groups, disabled candidates or armed forces veterans (n=5,482 employers). |
| Manufacturing |
1.5% |
5,132 |
Manufacturing: 1.5% of employers explicitly welcome at least one of under-represented groups, disabled candidates or armed forces veterans (n=5,132 employers). |
| Wholesale & retail |
1.2% |
4,508 |
Wholesale & retail: 1.2% of employers explicitly welcome at least one of under-represented groups, disabled candidates or armed forces veterans (n=4,508 employers). |
| Hospitality & food service |
1% |
4,811 |
Hospitality & food service: 1% of employers explicitly welcome at least one of under-represented groups, disabled candidates or armed forces veterans (n=4,811 employers). |